

A user reports that a sales document contains the wrong value. You set a breakpoint, step through the transaction, and quickly find yourself inside hundreds of SAP standard methods, BAdIs, function modules, and custom enhancements. The debugger is working perfectly—but your investigation is going nowhere.
That is the real ABAP debugging problem: not knowing how to start the debugger, but knowing where to make it stop.
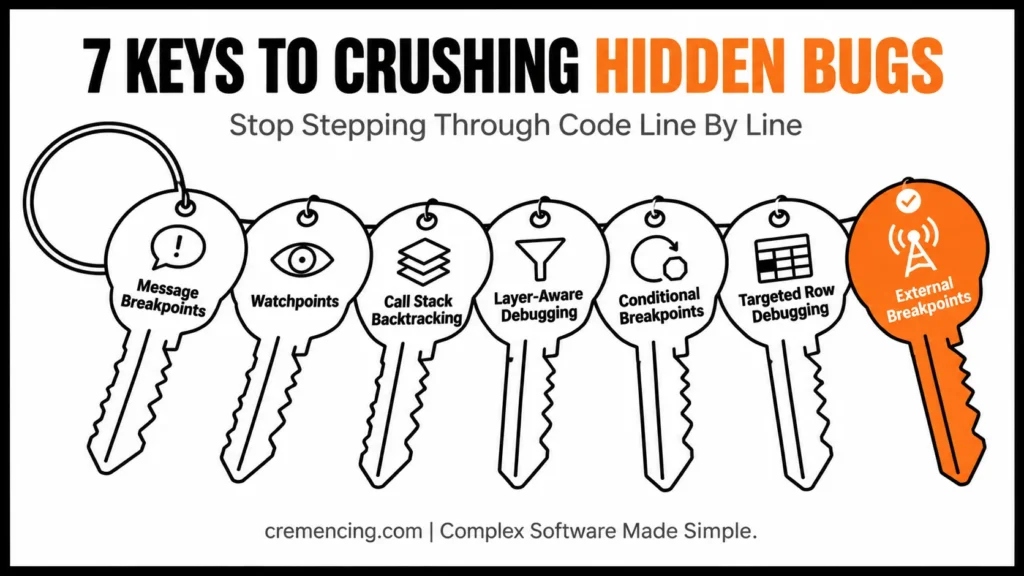
For experienced ABAP developers working with ECC or SAP S/4HANA, the fastest investigations usually come from narrowing the execution path. A message breakpoint can take you directly to the code that raises an error. A watchpoint can reveal where a value changes. A conditional breakpoint can skip thousands of irrelevant loop iterations. Layer Profiles can reduce standard-code noise, while external breakpoints help trace HTTP and RFC requests.
These seven ABAP debugging techniques focus on that investigation mindset: reduce the search space, identify the first incorrect state, and then trace the code responsible.
Why Most Developers Waste Time Debugging
The worst debugging error is that of trying to read the code.
A lot of developers will get an incident ticket, set a breakpoint at the beginning of the process, and start stepping through thousands of lines of code. Still after 30 minutes, they don’t know which object has changed the value, triggered the message, or updated the database.
The ABAP debugger provides several tools specifically designed to avoid this situation. Watchpoints, message breakpoints, conditional breakpoints, and call stack analysis allow you to focus only on the code that matters.
The goal isn’t to inspect every statement. The goal is to identify the exact moment incorrect behaviour appears.
The following ABAP debugging tips help experienced developers do exactly that.
Tip #1 – Use Message Breakpoints Instead of Searching Entire Programs
When users report an error message, many developers search the entire codebase looking for the message class.
That approach works, but it is slow.
A faster method is to create a breakpoint directly on the message.
From the ABAP Debugger:
- Open Breakpoints
- Choose Breakpoint at Message
- Enter Message Class
- Enter Message Number
When the message executes, the debugger stops exactly where the error originates.
Example:
MESSAGE e001(zsales)
WITH lv_customer.
Instead of searching every include and enhancement, the debugger immediately stops at the source.
| Debugging tool | Best for | Stops when | Typical scenario |
|---|---|---|---|
| Line breakpoint | Known code location | Execution reaches line | Known defect |
| Message breakpoint | Known SAP/application message | Message executes | Unexpected error |
| Watchpoint | Unknown data change | Watched value changes | Field overwritten |
| Conditional breakpoint | Known condition | Condition becomes true | Specific record |
| External breakpoint | HTTP/RFC request | External request reaches code | Fiori/integration |
| Layer Profile | Standard-code noise | Configured layer is entered/exited | Complex SAP stack |
This ABAP debugging tip is particularly useful when debugging:
- SAP standard transactions
- User exits
- BAdIs
- Enhancement spots
- Pricing procedures
For large systems, this is one of the most valuable SAP debugging tips and tricks available.
Tip #2 – Watchpoints Beat Breakpoints for Data Corruption Issues
Suppose a material price changes unexpectedly.
You know the final value is incorrect.
You don’t know where it changed.
A standard breakpoint will not help because you don’t know the responsible program.
This is where watchpoints become powerful.
Create a watchpoint on the field being modified.
Example variable:
lv_net_price.
When the value changes, the debugger automatically stops.
Example:
DATA lv_net_price TYPE kbetr.
lv_net_price = 100.
lv_net_price = 75. “Debugger stops here
This technique works extremely well for:
- Pricing issues
- Quantity changes
- Master data updates
- Internal table modifications
- Unexpected field overwrites
Many experienced consultants consider watchpoints one of the most underused ABAP debugging techniques.
Tip #3 – Use Call Stack Backtracking to Find Root Causes Faster
Most bugs appear long before users notice them. The transaction may fail in Program C even though the incorrect value originated in Program A. Instead of following execution forward, inspect the call stack.
The Call Stack view shows every procedure that led to the current execution point.
Typical chain:
REPORT ZMAIN
↓
FUNCTION Z_VALIDATE
↓
METHOD PROCESS_ORDER
↓
MESSAGE E001
By walking backwards through the stack, you can identify where the data first became invalid. This approach is significantly faster than stepping through every line of execution.
It is especially effective when debugging:
- RFC calls
- Workflow issues
- BAdIs
- Enhancement Framework implementations
- SAP standard transactions
[INTERNAL LINK: ABAP Call Stack Analysis → Understanding SAP Runtime Execution]
Tip #4 – Layer-Aware Debugging Cuts Through SAP Standard Noise
One of the biggest frustrations in SAP debugging is stepping into thousands of lines of SAP standard code when you only care about custom developments.
This is exactly why SAP introduced Layer-Aware Debugging.
Layer-Aware Debugging allows you to define object sets and debugging profiles so the debugger focuses only on selected packages, namespaces, or custom developments. Instead of stopping in every SAP standard method, the debugger jumps directly to the layers you want to analyze. SAP documents this feature through Layer Profiles and transaction SLAD.
This becomes extremely useful when debugging:
- Custom enhancements
- User exits
- BAdIs
- Z programs
- Partner-developed add-ons
Instead of navigating:
SAP Standard
↓
SAP Standard
↓
SAP Standard
↓
Z Enhancement
You can jump directly to:
Z Enhancement
Many senior ABAP developers never use this feature even though it can eliminate a huge amount of unnecessary navigation. To learn more about the reasons Which is destryoging you SAP SAP performance?
Tip #5 – Conditional Breakpoints: Eliminate Endless Loop Analysis
A common debugging scenario involves large loops.
For example:
LOOP AT gt_sales INTO gs_sales.
” Business logic
ENDLOOP.
The issue only occurs on record number 2,500.
Without a condition, you’ll step through thousands of iterations before reaching the problematic record.
Instead, use a conditional breakpoint.
Example condition:
sy-tabix = 2500
Or:
gs_sales-vbeln = ‘50001234’
The debugger runs normally and stops only when the condition becomes true.
SAP debugger documentation supports conditional breakpoints and watchpoint conditions specifically to narrow execution analysis.
This technique is particularly useful for:
- Pricing procedures
- IDoc processing
- Batch jobs
- Data migration programs
- Large internal tables
Many developers spend hours stepping through loops that could be skipped entirely with a single condition.
Tip #6 – Debug the Exact Internal Table Row Causing Problems
Sometimes an internal table contains thousands of entries.
Only one row causes the failure.
The challenge is identifying which row.
Consider:
LOOP AT gt_material INTO gs_material.
CALL METHOD lo_processor->validate.
ENDLOOP.
Instead of manually checking every record, combine watchpoints with conditional breakpoints.
Example:
gs_material-matnr = ‘MAT1000’
Or:
gs_material-status = ‘E’
The debugger stops exactly when the problematic row is processed.
Reddit discussions among ABAP developers repeatedly recommend watchpoints and targeted conditions over line-by-line execution when tracking changing values inside internal tables.
This approach is one of the most effective SAP ABAP debugging tips and tricks for investigating the following:
- Material determination issues
- Pricing records
- Failed validation checks
- Incorrect status updates
- Data migration errors
Tip #7 – Use External Breakpoints for RFC, OData, and Fiori Requests
Traditional breakpoints work only inside your current SAP GUI session.
Modern SAP systems rarely execute business processes in a single session.
Today, many requests originate from:
- SAP Fiori applications
- OData services
- RFC calls
- Web services
- Background processes
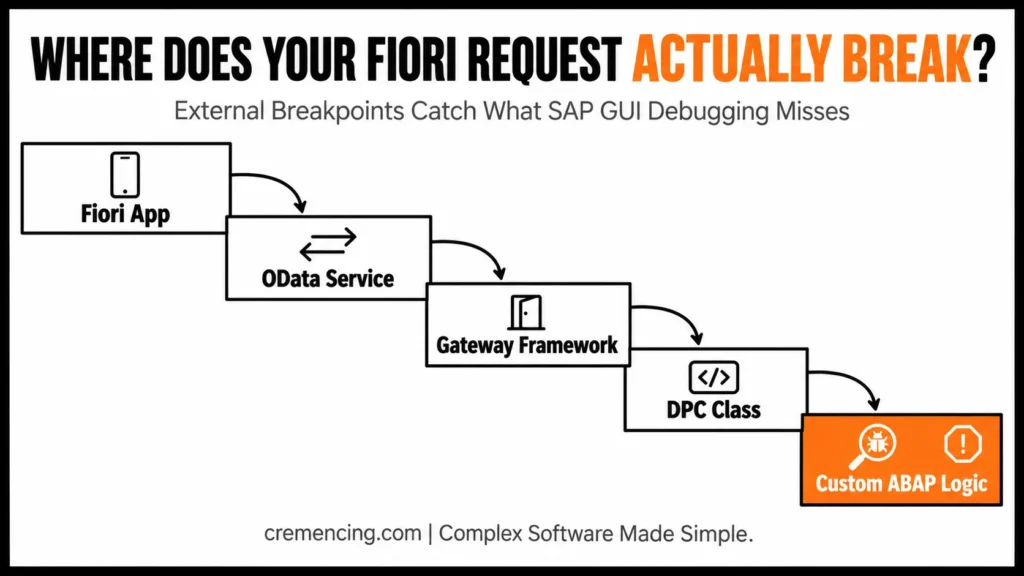
In these cases, standard breakpoints often never trigger.
Instead, use External Breakpoints.
External breakpoints allow the debugger to stop execution when requests arrive from external sessions.
Example OData flow:
Fiori App
↓
OData Service
↓
Gateway Framework
↓
DPC Class
↓
Custom ABAP Logic
Without an external breakpoint, debugging may never activate. With an external breakpoint, execution stops immediately when the request enters your ABAP code.
| Debugging situation | Best first tool | Why |
|---|---|---|
| You know the exact failing line | Line breakpoint | Stops at a known location |
| You know the message | Message breakpoint | Finds where the message is raised |
| A value changes unexpectedly | Watchpoint | Stops when the monitored value changes |
| Only one record causes the problem | Conditional breakpoint | Skips irrelevant iterations |
| SAP standard code creates too much noise | Layer Profile | Controls debugger navigation through configured object sets |
| Fiori/HTTP request never reaches your breakpoint | External breakpoint | Handles separate HTTP sessions |
| RFC request executes outside your dialog session | External breakpoint | Designed for RFC debugging |
| Background job fails | SM37 / appropriate background debugging procedure | Background execution requires a separate debugging approach |
ABAP debugging techniques is essential for modern SAP S/4HANA development because most Fiori applications communicate through OData services rather than traditional SAP GUI transactions. https://cremencing.com/sap-joule-abap-code-generation-how-ai-changes-abap-development-in-s-4hana-2026/
Conclusion
Most developers learn how to use the ABAP debugger within their first few months of SAP development. The real skill, however, is knowing how to investigate problems efficiently. Fore more insight on ABAP Cloud vs. Classic
The most effective ABAP debugging tips and tricks aren’t about memorizing debugger buttons. They’re about reducing the search space. Message breakpoints help locate hidden errors instantly. Watchpoints reveal unexpected data changes. Call stack analysis exposes root causes faster. Layer-aware debugging removes SAP standard noise. Conditional breakpoints eliminate unnecessary loop analysis, while external breakpoints make modern Fiori and OData troubleshooting possible. Incorrect database operations are one of the biggest reasons behind slow programs, and developers must understand ABAP database performance issues to troubleshoot them effectively.
Master these ABAP debugging techniques, and you’ll spend far less time chasing bugs and far more time solving them.
Frequently Asked Questions
1. What is the difference between a breakpoint and a watchpoint in ABAP?
A breakpoint stops execution at a specific line or statement. A watchpoint only stops execution when a monitored variable changes value. Watchpoints are often more effective when investigating hidden data changes. SAP specifically documents watchpoints as a tool for monitoring variable changes during runtime.
2. Which ABAP debugging technique is best for finding unexpected field changes?
Watchpoints are usually the fastest solution. Instead of searching the entire application, the debugger immediately stops when the value changes, allowing you to identify the responsible code section.
3. How do I debug SAP standard code efficiently?
Avoid stepping through every line. Use message breakpoints, call stack analysis, watchpoints, and layer-aware debugging. Experienced ABAP developers consistently recommend targeted debugging over manual navigation through SAP standard programs.
4. What is Layer-Aware Debugging?
Layer-Aware Debugging allows developers to focus only on selected object sets or namespaces during debugging. SAP provides this feature to reduce navigation through unrelated standard code.
5. Can I debug RFC function modules?
Yes. External breakpoints allow debugging of RFC calls, web services, and external requests. They are especially useful when the execution occurs outside your current SAP GUI session.
6. How do I debug SAP Fiori applications?
The most common approach is setting external breakpoints in the Gateway DPC or extension classes. When the OData request reaches the backend system, the debugger activates automatically.