
The assumption behind most SAP CALM Health Monitoring rollouts is simple: connect the system, watch the dashboard, and you’ll know about trouble before your users do. That assumption is wrong more often than teams realize — not because the tool doesn’t work, but because “connected” and “monitored” are different things, and most landscapes only achieve the first one.
A system can report every metric correctly, show green across the board, and still produce zero warning when something breaks — because the event that would have fired was never activated, or the threshold was left at a default that doesn’t match the system’s real growth pattern. This isn’t a flaw in SAP CALM Health Monitoring; it’s a gap in how it’s configured. This guide covers what the tool can actually detect early, the seven-step chain required to make that detection real, and where it should hand off to a different Cloud ALM application entirely.
Early Warning Dynamics in Enterprise Cloud Observability
Recent benchmarks from SAP Cloud ALM operational studies reveal that proactive metric monitoring reduces Mean Time to Detect (MTTD) system anomalies by over 45% across hybrid enterprise landscapes. According to Gartner’s 2026 Observability Frameworks report, organizations combining technical health monitoring with synthetic and real-user monitoring (RUM) lower unexpected user-facing downtime by 60%. Furthermore, enterprise data demonstrates that nearly 35% of unaddressed technical warnings stem from misconfigured threshold triggers rather than underlying system failures, underscoring the vital role of automated event-to-alert orchestration in clean core operations.
Why SAP CALM Health Monitoring Misses Trouble
SAP CALM Health Monitoring can spot some technical problems before users notice them, but it does not predict every failure. It evaluates supported metrics and reported events, rates them as OK, warning, or critical, and creates alerts only when the required configuration is active.
The Complete Warning Chain — Break Any Link, Alert Fails
- Supported metric exists for the condition
- Data collection is active
- Threshold is tuned to real workload (not left at default)
- Event is activated
- Alert reaction is assigned (email/ticket/chat)
- Responsible owner is identified
- Corrective action path is defined
The complete warning chain is:
Supported metric → active data collection → meaningful threshold → enabled event → alert reaction → responsible owner → corrective action
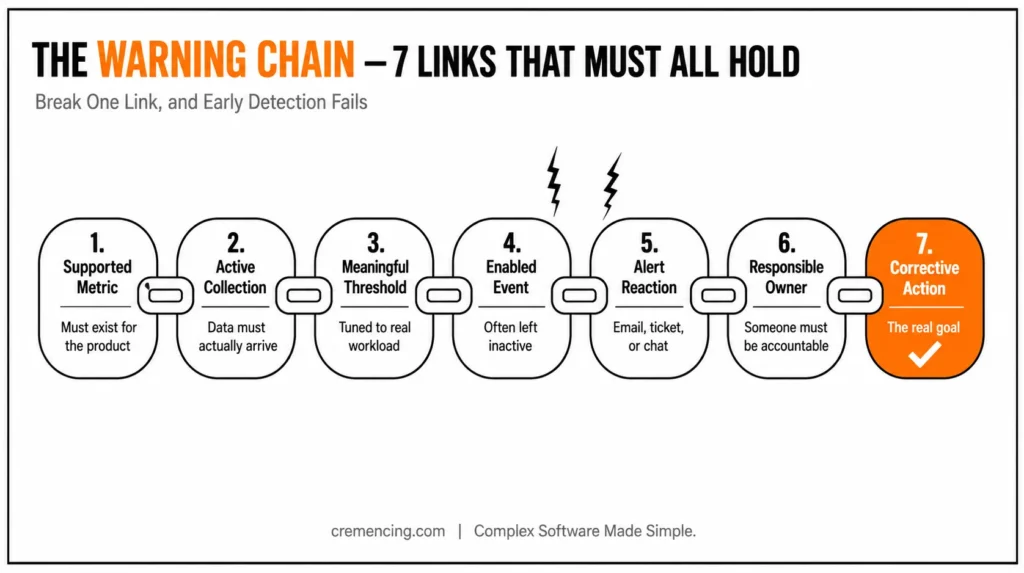
Break any link, and early warning fails. A system can be connected correctly and still produce no email, ticket, chat message, or operational response.
Health monitoring is strongest when a problem appears as a measurable technical condition. Typical examples include increasing memory use, storage pressure, quota consumption, component unavailability, certificate expiry, failed service tasks, disconnected consumers, or a provider-reported error.
It is weaker when the failure exists only inside a user journey or business process. A healthy application server can still support a slow Fiori transaction, a delayed purchase order, a failed integration message, or a job that finishes too late. That distinction matters because green infrastructure is not the same as a healthy business service.
What SAP CALM Health Monitoring actually watches
SAP Cloud ALM Health Monitoring receives metrics from supported managed components. The available metrics depend on the product, release, setup method, and Cloud ALM capability.
The application typically helps teams review:
- Availability and connectivity
- CPU, memory, storage, and quota use
- Service-specific health ratings
- Certificate validity
- Technical errors reported by the managed service
- Metric history and rating changes
- Active alerts and their status
- Collection or communication failures
The data can come through different mechanisms. Some cloud services push metrics, some expose endpoints, and supported ABAP systems require managed-system setup.
Collection frequency also differs by product and provider. SAP CALM Health Monitoring is therefore not universally real-time.
A five-minute collection interval may be early enough for a certificate that expires next week, but it may miss a short outage that affects users for ninety seconds.
SAP CALM Health Monitoring: Early Detection, Not Predictive AI
The title’s word “before” needs a precise interpretation. SAP CALM Health Monitoring can detect a condition before users report it when the metric changes early enough and the configured threshold produces an event.
It does not guarantee failure prediction through artificial intelligence. The system reacts to observed health data and reported events.
For example, storage can move from 70% to 85%, cross a Warning threshold, and alert the Basis team before writes fail. That is useful early detection.
A transaction that fails instantly because of an application defect may reach users before any general health metric changes. That requires another signal, such as real user monitoring, synthetic user monitoring, business process monitoring, or application-specific logs.
Step-by-Step Fix: Configure SAP CALM Health Monitoring for Early Warning
The fix is not one switch. You must configure the managed component, metric, threshold, event, reaction, and operational owner as one chain.
Step 1: Confirm that the product and capability are supported
Start with the SAP Cloud ALM supported solutions documentation. Do not stop after finding the product name.
Confirm that Health Monitoring supports the required product and release. Then review the exact metric catalog and setup guide.
Ask five questions:
- Is the product supported?
- Is health monitoring supported for that product?
- Which metrics and events are available?
- How often is the data collected?
- What prerequisites are required?
A supported S/4HANA system may expose different health information from SAP HANA Cloud, SAP Datasphere, SAP Cloud Connector, or SAP Integration Suite Event Mesh.
Step 2: Complete managed-component setup
For supported ABAP systems, teams commonly use /SDF/ALM_SETUP.
/SDF/ALM_SETUP is the SAP-provided setup program used to register and configure an ABAP system for SAP Cloud ALM scenarios. Run it only after checking the required SAP_BASIS level, ST-PI support package, correction instructions, outbound HTTPS connectivity, technical user, and authorizations.
Each SID and client combination requires its own registration. Do not assume that connecting one client covers the complete system. Cloud services use product-specific setup. Some require service keys, endpoints, subscriptions, or provider-side activation.
After setup, confirm that the managed component appears in the landscape and that current metrics arrive. A green setup status proves connectivity; it does not prove that SAP CALM alerts work.
Step 3: Add the component to the monitoring scope
Open the SAP CALM Health Monitoring configuration and include only components with an operational owner.
Monitoring everything without ownership creates noise. Every selected component should have:
- A business or technical purpose
- A support team
- A severity model
- A response target
- An escalation path
Group related components where useful, but keep the structure clear enough to identify which service, tenant, system, or instance has failed.
Step 4: Tune SAP Cloud ALM thresholds to the real landscape
SAP provides default threshold settings for many metrics, but defaults cannot know your workload, peak periods, available headroom, or recovery time.
A useful threshold should consider:
- Normal baseline
- Month-end or seasonal peaks
- Rate of change
- Remaining capacity
- Time required to recover
- Business criticality
- Support-team availability
Suppose storage reaches 90% and the team needs four hours to extend capacity. A critical threshold at 95% may be too late.
A better design may create a Warning at 80% and Critical at 88%, provided those levels match the system’s real growth pattern. The aim is actionable notice, not the earliest possible alarm.
Use numeric thresholds for measures such as memory or disk. Use status mappings or text rules when the provider reports states such as Available, Degraded, Disconnected, or Failed. Monitoring relies heavily on the same endpoints covered in our SAP CALM API guide to authentication and data access.
Step 5: Activate events
This is where many SAP CALM health monitoring setups fail. Available events can remain inactive even while the dashboard displays metrics.
Activate only the events that represent conditions requiring action. An event can reflect a rating change, technical error, unavailable component, certificate condition, or another provider-defined state.
Check whether an alert should open when the metric moves from OK to Warning, Warning to Critical, or both. Also review how the event clears when the metric recovers. Do not activate every event immediately. Start with conditions that protect a critical service, then expand after measuring alert quality.
Step 6: Assign alert reactions
An alert inside SAP Cloud ALM is useful only if the correct team sees it.
Depending on the supported configuration and integrations, reactions can include:
- Create a Health Monitoring alert
- Send email
- Send a chat message
- Create or update an ITSM ticket
- Start an operation flow
- Trigger an automation or webhook-driven process
Map severity to action. A Warning may send email to the support queue, while a Critical event may create a ticket and notify the on-call team. Define who receives the alert, who owns triage, when escalation begins, and who confirms recovery. Avoid shared mailboxes with no response rule.
Step 7: Test the complete warning chain
Do not finish with “metrics are visible.” Test from threshold breach to human action.
For a non-production component, create a controlled condition where possible. Lower a test threshold temporarily, stop a safe test service, or use a provider-supported simulation.
Then confirm:
- The metric changes.
- The rating changes.
- The event activates.
- The alert appears.
- The notification or ticket arrives.
- The owner can identify the affected component.
- Recovery closes or updates the alert correctly.
Return temporary settings to their approved values after testing.
Five issues SAP CALM Health Monitoring can catch early
1. An expiring Cloud Connector certificate
Cloud Connector health metrics can expose certificate validity, availability, ping time, connected subaccounts, backend calls, and Java heap.
A warning configured before expiry can give the team time to renew the certificate before connectivity stops.
2. HANA Cloud resource pressure
Supported HANA Cloud metrics and alerts can expose transaction activity, read and write requests, column unloads, or database-reported health conditions.
These signals can show rising pressure before application failures become widespread.
3. Datasphere capacity and failed tasks
For SAP Datasphere, SAP CALM Health Monitoring can report memory and disk use, out-of-memory conditions, failed tasks, queued statements, and rejected statements. A growing queue or capacity warning can appear before analysts start opening tickets.
4. Event Mesh backlog risk
Event Mesh metrics can show active consumers, active connections, broker readiness, queue count, and message-spool use. Falling consumer activity combined with increasing spool use can reveal a developing backlog.
5. Expensive ABAP outbound communication
SAP documents a scenario that uses ABAP statistics records to identify expensive outbound communication during a recent collection window. A configured alert can notify the team before repeated calls create broader performance pressure.
These examples work because the failure has a supported metric or event. Always verify that condition before promising early detection.
How to Verify Your SAP CALM Health Monitoring Fix
A successful verification proves more than email delivery. It proves that the alert contains enough context for a support team to act.
Review the Monitoring page first. Confirm that the component has current data, expected metric history, the correct rating, and no collection error. Then review the Alerting page. Check the alert source, severity, opening time, affected component, metric or event, status history, and recovery behavior.
Validate every configured reaction. If email is enabled, confirm the recipient, subject, timestamp, severity, and link back to the relevant Cloud ALM object. If ITSM integration is enabled, confirm that the external ticket contains the correct component, alert identifier, description, priority, and status mapping. Test both opening and closing behaviour.
Measure detection time during the controlled test:
Detection time = collection delay + evaluation delay + notification delay
Compare that value with the operational requirement. A certificate alert can tolerate minutes. A revenue-critical service may require a faster and more user-focused signal.
What SAP CALM Health Monitoring Success Looks Like
During the first month, review SAP CALM Health Monitoring alert performance as an operational control rather than a technical installation. Track how many alerts were actionable, duplicated, ignored, or discovered after a user ticket.
For each alert, compare the first metric breach, alert creation, notification receipt, acknowledgement, and recovery time. This shows whether delay comes from data collection, threshold design, routing, or team response.
Also record important incidents that produced no health monitoring alert. Classify each gap as an unsupported metric, inactive configuration, collection delay, incorrect threshold, or wrong monitoring application.
Use those findings to tune the design. Early warning improves through measured review; it does not become reliable simply because the initial configuration was activated.
Use the right SAP Cloud ALM monitoring application
| What you need to detect | Best capability |
| CPU, memory, storage, quota, certificate, availability | Health Monitoring |
| Slow or failed real-user requests | Real User Monitoring |
| Failure of a scripted user journey | Synthetic User Monitoring |
| Failed or delayed integration messages | Integration and Exception Monitoring |
| Business-document backlog or lead-time issue | Business Process Monitoring |
| Failed or long-running jobs | Job and Automation Monitoring |
| Impact across a complete business service | Business Service Management |
SAP CALM Health Monitoring should contribute to an observability design, not carry every monitoring use case alone.
SAP CALM Health Monitoring Mistakes That Bring Alerts Back
Mistake 1: Treating connectivity as completed monitoring
A connected system can send data without active events or reactions. Always verify the full warning chain.
Mistake 2: Keeping every default threshold
Defaults are starting values. Compare them with real baselines, growth rates, business peaks, and recovery time.
Mistake 3: Activating every event
Too many SAP CALM alerts train support teams to ignore them. Activate events with clear owners and responses, then review alert volume and usefulness.
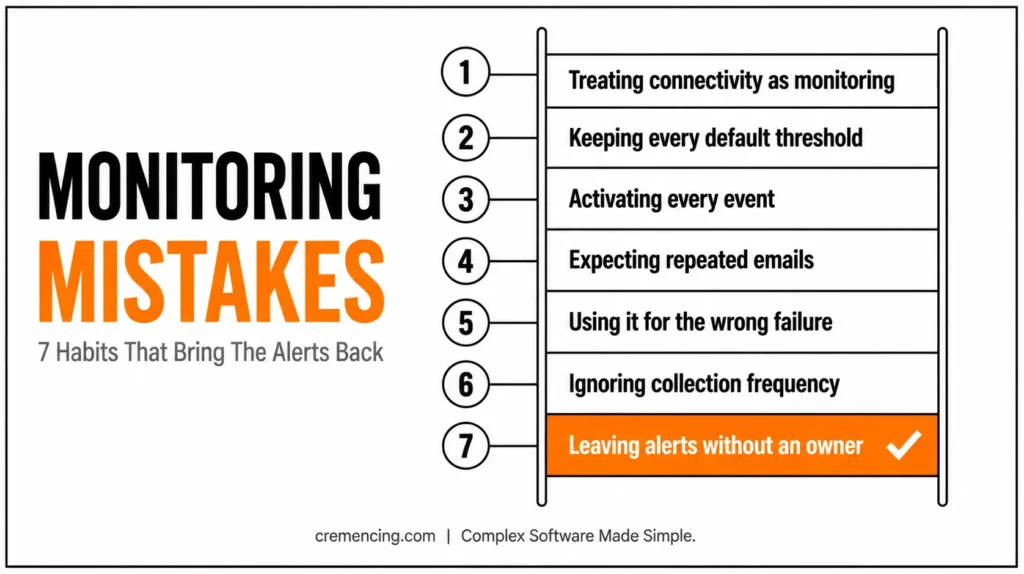
Mistake 4: Expecting repeated emails for an unchanged condition
Health monitoring generally reacts to rating transitions. If a metric stays critical, the system may not send a fresh email on every collection cycle.
Use escalation rules, ticket workflows, or external paging when repeated reminders are required.
Mistake 5: Using Health Monitoring for the wrong failure
A technically healthy system can still have a failed interface, slow Fiori journey, delayed job, or blocked business process.
Select the Cloud ALM application that observes the actual failure.
Mistake 6: Ignoring collection frequency
A metric collected every few minutes cannot provide second-level warning. Match collection timing to the speed of the failure and use another tool when the requirement is faster.
Mistake 7: Leaving alerts without an owner
An SAP CALM health monitoring alert with no accountable team is only stored information. Assign ownership, response targets, escalation, and closure responsibility.
SAP CALM Health Monitoring: Final Verdict
SAP CALM Health Monitoring can spot trouble before users do, but only when the signal and the response design are both complete. The platform needs a supported metric, active collection, a useful threshold, an enabled event, a working reaction, and an accountable owner.That makes it effective for capacity pressure, component availability, expiring certificates, service errors, and other measurable technical conditions. It does not guarantee early warning for every slow transaction, failed interface, delayed job, or blocked business process.
The practical goal is not to make one dashboard responsible for everything. Use health monitoring for technical health, pair it with the right cloud ALM applications for users and processes, and test the complete warning chain before relying on it in production.
Frequently Asked Questions
1. What is SAP CALM Health Monitoring?
SAP CALM Health Monitoring is an SAP Cloud ALM operations application that collects supported technical health metrics and events. It displays availability, resource use, errors, trends, ratings, and alerts for configured managed components. Its purpose is early technical detection, not complete monitoring of every user or business-process failure.
2. Does SAP Cloud ALM monitor on-premise SAP systems?
Yes, SAP Cloud ALM can monitor supported on-premise SAP systems for documented use cases. Supported ABAP systems commonly use /SDF/ALM_SETUP for registration and configuration. Coverage depends on the release, managed component, prerequisites, and available SAP Cloud ALM system-monitoring metrics.
3. How are Health Monitoring alerts generated?
Alerts are generated when an active event detects a configured condition, often after a metric rating changes from OK to Warning or Critical. Data collection, thresholds, event activation, and an alert reaction must all be configured. Visible metrics alone do not guarantee an SAP CALM alert.
4. Why do Health Monitoring emails arrive only once?
Health Monitoring notifications commonly follow rating transitions rather than every repeated collection. If a metric remains Critical, a new email may not be generated on each cycle. Use ticket escalation, chat integration, or an external paging process when recurring reminders are required.
5. Can I create custom thresholds in SAP Cloud ALM?
Yes. Administrators can override supported metric thresholds using numeric values, status mappings, or text-based rules where available. Custom SAP Cloud ALM thresholds should reflect normal load, peak periods, remaining capacity, recovery time, and business impact.
6. Can SAP CALM monitor HANA backups?
Do not assume that SAP CALM Health Monitoring provides complete HANA backup administration. Coverage depends on the specific HANA product and available metrics. Detailed backup status, recovery checks, and database administration may still require SAP HANA cockpit, native database tools, Focused Run, or another approved monitoring solution.
7. What happens if SAP CALM Health Monitoring shows a metric but no alert fires?
This usually means the metric is being collected but the corresponding event has not been activated, or no alert reaction has been assigned. Visible metric data confirms connectivity only — teams still need to enable the specific event and configure a reaction (email, ticket, chat) for that alert chain to work.
8. Does SAP CALM Health Monitoring replace the need for Real User Monitoring?
No. Health Monitoring tracks technical component health (CPU, memory, storage, certificates), while Real User Monitoring tracks actual user experience like slow transactions or failed page loads. A system can pass all health checks while users still experience a broken or slow business process.
9. How long does it typically take to see reliable alerts after initial setup?
There’s no fixed timeline, since it depends on tuning thresholds to real workload patterns rather than relying on defaults. Most teams need at least a few weeks of monitoring data to distinguish genuine issues from noise and adjust thresholds, event activation, and alert routing accordingly.
10. Can SAP CALM Health Monitoring alerts be routed to different teams based on severity?
Yes, depending on configuration. Organizations commonly map lower-severity alerts (like a Warning rating) to a support queue via email, while Critical alerts trigger ticket creation and on-call notification — ensuring the right team responds based on urgency rather than every alert going to the same inbox.
References
SAP Cloud ALM Health Monitoring